How it works
In the following paragraphs, I'll go through each part of the simulation. Feel free to jump straight to a specific section if you like.Parameters and status
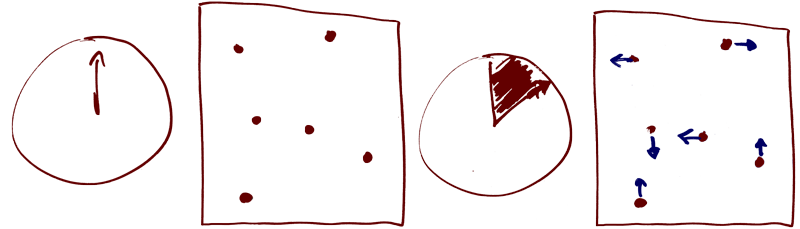
Population settings
The population density is the number of individuals that should be created on the
board.
This board has size 300x300, so 100% density will lead to a total of 90.000 individuals.
Based on this initial number, you can then pick how many of them will be infected by setting the
number of infected people.
Human move strategy
This parameter will set the movement strategy of a single individual among 5 options: "up",
"down",
"left", "right" and "nothing".
The random strategy is self-explanatory.
The random with direction memory strategy comes from an observation from the
simulation: each individual was moving around their initial spawn point, not actually mimicking
the real human behavior.
This strategy creates an imbalance in the possible choices, making the "previous move" more
likely to be chosen.
The social distancing strategy starts to show some kind of "intelligence".
Before moving, an individual evaluates which move maximizes the distance between itself and any
other individual in its range of sight.
This local behaviour results in a very beautiful ordered disposition of individuals on the
board.
Infection parameters
These parameters control the infection features.
The infection range defines the area of infection of a single individual.
The incubation time defines the time needed to an individual to move from the
susceptible state to the infected state.
The infection and re-infection probabilities define the probability of
infection for a susceptible and cured individual respectively.
The cure and death probabilities are self explanatory.
Status
The "status" section and chart give you a visual and textual, real-time status of the
simulation.
The R-0 parameter is evaluated as the average of
infected people by each individual. (Since this is a simulation, we can do this easily!)
Simulation structure
This simulation makes use of an internal "clock" and performs actions at each "tick".
At each tick, an individual's status can be one of the following: susceptible,
exposed, infected, cured, dead.
The initialization phase evaluates the number of individuals from the density
parameter and randomly places these individuals on the board.
For each tick, all the individuals perform a sequence of actions based on their current
status.
We will cover that in the next section.
Human behavior
Each individual will perform the following actions for each tick.Let's take an individual as an example.
Infect
If the current individual is infectious, the infection could spread on other susceptible or
cured
individuals, based on the infection radius, infection probability, and
re-infection probability.
Get cured
There's a probability that our individual will overcome the infection and be cured.
If this happens, the individual will move from the infected status to
cured.
Die
If our individual was not cured, he could eventually die, based on the death
probability.
If this happens, the individual will move from the infected status to
died.
Move
Let's say that our individual does not die.
In this case, he will try to move around using the pre-set
move strategy.
Epidemiology Fundamentals
While developing this tool, I've had the opportunity to conduct some online research into what models are currently used to simulate and analyse the development of an epidemic.I would like to share some of the theory that relies on this simulation.

Compartmental models
Compartmental modelling is a methodology that classifies the individuals
into a finite number of states and defines which way an individual could move from one state to
another.
Each state is associated with a letter.
- S: Susceptible
An individual is susceptible when there's a probability of being infected. - I: Infectious
An infectious individual has been infected and can infect susceptible individuals. - R: Removed
A removed individual is either dead or cured (immune).
Depending on the specific model, this label could be referring to cured people only. - D: Dead
A dead individual is... well... dead and it is out of the simulation. - E: Exposed
An exposed individual has been infected but is not yet contagious. - C: Carrier
A carrier individual does not show symptoms (is basically susceptible) but is still infectious. - M: Maternally-derived immune
For some infections, individuals can be temporarily immune to the disease, then move to the susceptible state.
Using these building blocks, we can model different epidemic behaviors.
The most common model is SIR. This model has been used to describe epidemics like COVID-19.
The key assumption here is that after being cured, an individual cannot get sick
again.
Other diseases, like common flu, are modeled using an SIS model, in which the death probability
is zero and after being cured, an individual is again susceptible to the disease.